The Christkind's - Upgrading the Production Line Excel

Story
As the Christkind settled into the workshop, a wave of excitement filled the air. The production line was buzzing with activity, and the elves were working diligently on their tasks. However, amidst the festive atmosphere, the Christkind knew that keeping track of progress was crucial for ensuring everything would be ready for Christmas Eve.
One day, while reviewing the production status with the controller, a request emerged. The controller expressed a desire for a more visual representation of the work being done. “I need an Excel report that shows a burndown chart of our production,” he said, rubbing his hands together as he contemplated the amount of work still to be done.
The Christkind nodded, recognizing the importance of this request. “A burndown chart would definitely help us monitor our progress effectively,” it replied. “We can see how many tasks are remaining and how quickly we’re completing them. Let’s get started on this right away!”
Implementation of the Burndown Chart
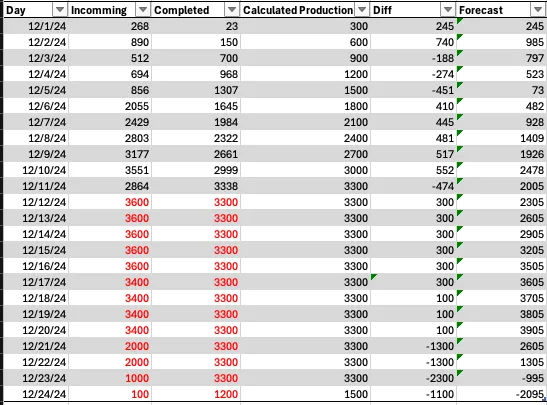
Step 1: Define the Data
The first step was to determine what data the controller needed. The Christkind gathered information on:
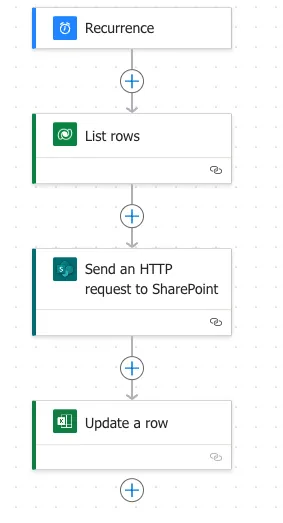
Step 2: Connect to Data Sources
To create the burndown chart, the Christkind decided to pull data from the production management PowerApp, which already integrated with Dataverse. Using Power Automate, it set up a flow to collect the daily task completion data and store it in a designated Excel file.
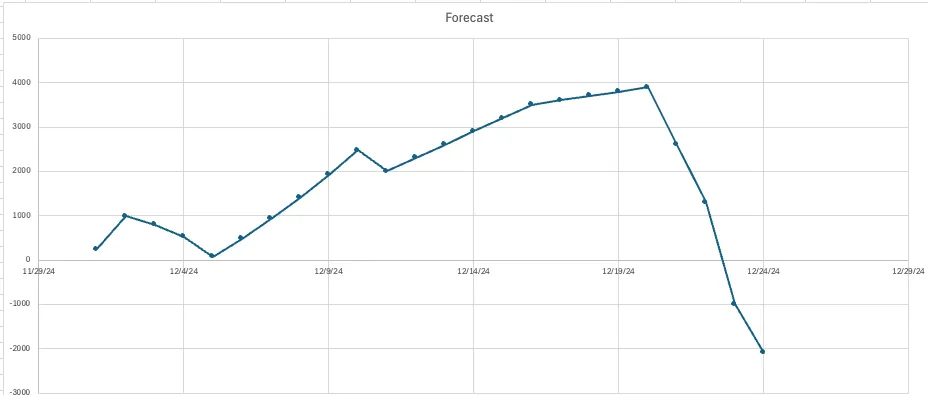
Step 3: Generate the Burndown Chart
With the data in place, the Christkind turned its attention to creating the burndown chart:
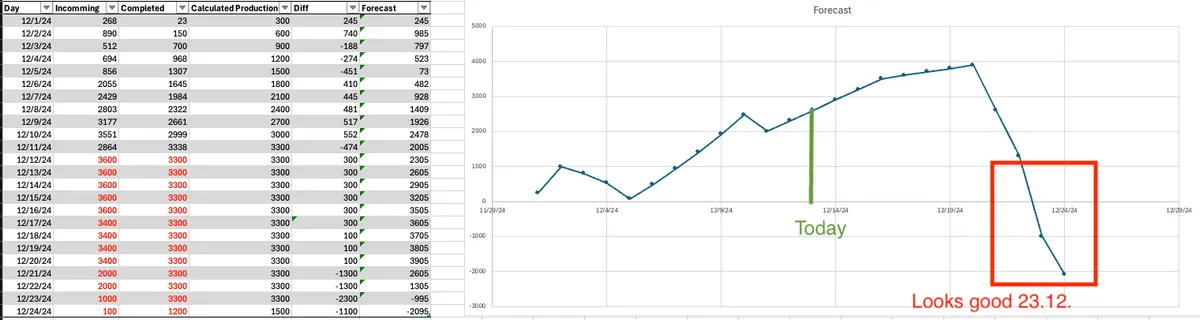
Remark
On the final day, it will be the moment of truth to see if everything is functioning as expected.
Links
- 1: The Challenge of the Letters
- 2: The Christkind’s Data Transformation - Transforming Letters into Forms
- 3: The Christkind’s Magical Email Solution
- 4: The Christkind’s Magical PWA - Transforming Children’s Letters into Digital Art
- 5: The Christkind’s Ingenious Snail Mail Solution - Bringing Letters to Life
- 6: The Christkind’s Ingenious Snail Mail Solution - Embracing the Flow
- 7: The Christkind’s Ingenious Snail Mail Solution - To the next level
- 8: The Christkind’s - Deployment Dilemma
- 9: The Christkind’s - Spreading the Christmas Spirit
- 10: The Christkind’s - Upgrading the Production Line PowerApps